
‘Still a great deal to do’: Figures show 3% of major roads in ‘poor condition’ across West Northants
The council has acknowledged that there is ‘still a lot of work’ to do to get the road network in a better state across West Northamptonshire as figures show 3 per of major routes are in a poor condition.
Figures, published by the Department for Transport (DfT), hows the proportion of locally managed major roads that were reported by councils in England as being in a poor condition in the year to March 2026.
Stats for West Northants show 3 per cent of the network is in poor condition, compared to 4 per cent recorded in the year up to March 2024.
Cllr Richard Butler, Cabinet Member for Highways and Transport, said: “The figures show some improvement, but we know there’s still a lot of work to do.
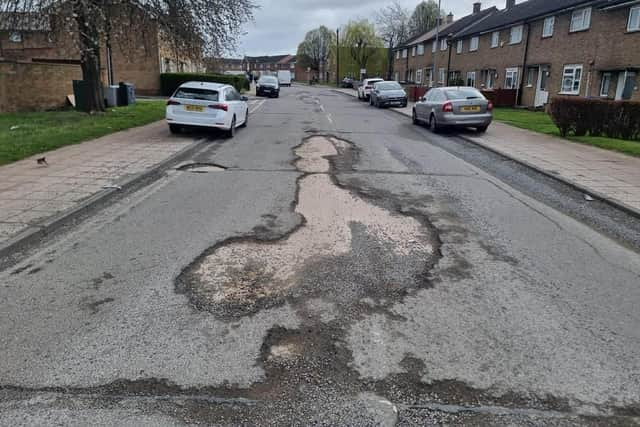

“There are still roads across West Northamptonshire that need attention and their condition matters enormously to the people who use them every day.
“Improving the network is a long-term job and there is still a great deal to do. Our focus is on getting the best value from the funding available, dealing with safety issues while also investing in planned and preventative maintenance that can help stop roads deteriorating in the first place.
“These figures suggest we’re moving in the right direction, but we know the real test for residents is what they see and experience on their own roads.
“We’ll keep getting on with the work and being open about both the progress we’re making and the challenges that remain.”
Local authorities are required to carry out regular surveys of road surfaces under their management and categorise them as red, amber or green, with red meaning the roads should have been considered for maintenance.
The figures refer to the proportion of the total A road and motorway classed as red in each council area, not the number of roads.
Most local authorities reported figures to the DfT that were collected using Scanner (Surface Condition Assessment for the National Network of Roads) technology.
Those authorities that used alternative methods to collect 2026 data are marked with an asterisk.
The list is ordered by the proportion of major roads classed as red, starting with the highest, and reads from left to right: name of upper-tier local authority; percentage of locally managed A road and motorway categorised as red in the year to March 2026; percentage of red A road and motorway in the year to March 2024.
Brighton & Hove* 17% (18%)
Nottingham* 15% (19%)
Brent 14% (11%)
North Tyneside* 13% (14%)
Salford* 13% (6%)
Ealing 12% (8%)
Newham 12% (10%)
Barking & Dagenham 11% (6%)
Hackney 11% (13%)
Barnet 10% (6%)
Bristol* 10% (9%)
Islington 10% (9%)
Shropshire* 10% (9%)
Calderdale* 9% (4%)
Camden 9% (9%)
Croydon 9% (7%)
Redbridge 9% (7%)
Richmond upon Thames 9% (7%)
Southwark 9% (7%)
Wandsworth 9% (6%)
Derby* 8% (9%)
Greenwich 8% (6%)
Hammersmith & Fulham 8% (5%)
Lambeth 8% (6%)
Southend-on-Sea* 8% (9%)
Tower Hamlets 8% (7%)
City of London 7% (7%)
Enfield 7% (4%)
Harrow 7% (4%)
Kent 7% (6%)
Lewisham 7% (6%)
Manchester* 7% (6%)
Norfolk 7% (4%)
Sutton 7% (3%)
Waltham Forest 7% (5%)
Bradford* 6% (6%)
Derbyshire* 6% (28%)
Haringey 6% (4%)
Havering 6% (4%)
Kingston upon Thames 6% (3%)
Merton 6% (4%)
Newcastle upon Tyne* 6% (6%)
Oxfordshire 6% (5%)
St Helens* 6% (6%)
Suffolk 6% (3%)
Telford & Wrekin* 6% (7%)
Westminster 6% (5%)
Windsor & Maidenhead 6% (3%)
Bath & North East Somerset* 5% (5%)
Bexley 5% (4%)
Bracknell Forest 5% (7%)
Bromley 5% (2%)
Bury 5% (6%)
Darlington* 5% (7%)
East Sussex 5% (4%)
Hampshire 5% (4%)
Herefordshire 5% (5%)
Kirklees 5% (5%)
Liverpool* 5% (10%)
Luton* 5% (5%)
Medway 5% (2%)
Reading 5% (7%)
Southampton* 5% (5%)
Stockport* 5% (4%)
Surrey 5% (4%)
Trafford 5% (5%)
West Sussex 5% (6%)
Wigan* 5% (2%)
Wirral* 5% (4%)
Blackburn with Darwen* 4% (5%)
Bournemouth, Christchurch & Poole 4% (3%)
Buckinghamshire 4% (4%)
Cheshire East 4% (3%)
Essex 4% (3%)
Hillingdon 4% (2%)
Kensington & Chelsea 4% (4%)
Knowsley* 4% (4%)
Lancashire 4% (2%)
Leicester 4% (4%)
Nottinghamshire* 4% (3%)
Oldham* 4% (4%)
Rochdale 4% (4%)
Somerset 4% (2%)
Warwickshire 4% (4%)
West Berkshire 4% (3%)
Westmorland & Furness 4% (4%)
Wiltshire 4% (4%)
Blackpool* 3% (4%)
Cambridgeshire 3% (6%)
County Durham 3% (3%)
Devon 3% (2%)
Doncaster 3% (3%)
Dorset* 3% (2%)
Hartlepool 3% (3%)
Hertfordshire 3% (3%)
Hounslow 3% (2%)
Leicestershire 3% (3%)
Lincolnshire 3% (2%)
North Lincolnshire 3% (3%)
North Northamptonshire* 3% (3%)
Northumberland 3% (2%)
Plymouth 3% (2%)
Rutland 3% (3%)
Sefton 3% (3%)
Solihull 3% (3%)
South Gloucestershire 3% (3%)
South Tyneside 3% (2%)
Staffordshire* 3% (3%)
Thurrock 3% (7%)
Torbay 3% (3%)
West Northamptonshire* 3% (4%)
Wokingham 3% (3%)
Wolverhampton 3% (2%)
Barnsley 2% (3%)
Bedford 2% (1%)
Birmingham* 2% (6%)
Bolton 2% (2%)
Central Bedfordshire 2% (2%)
Cornwall 2% (1%)
Coventry 2% (2%)
Cumberland 2% (2%)
Gateshead 2% (1%)
Isle of Wight 2% (2%)
Kingston upon Hull 2% (2%)
North East Lincolnshire 2% (2%)
North Somerset 2% (1%)
North Yorkshire* 2% (3%)
Portsmouth 2% (2%)
Redcar & Cleveland* 2% (1%)
Rotherham 2% (3%)
Sandwell 2% (2%)
Swindon 2% (3%)
Wakefield 2% (3%)
Warrington 2% (1%)
York 2% (2%)
Cheshire West & Chester* 1% (1%)
Dudley 1% (2%)
East Riding of Yorkshire 1% (2%)
Gloucestershire 1% (1%)
Halton 1% (1%)
Milton Keynes 1% (1%)
Peterborough 1% (1%)
Sheffield 1% (1%)
Stockton-on-Tees 1% (1%)
Sunderland 1% (1%)
Walsall 1% (1%)
Middlesbrough 0% (1%)