It is an average gate that is significantly higher that Cobblers for the last season – at 5.835.
So where would Cobblers be in this season's League One table if it was based on this season’s gate? Here we have the answers.
Get the latest Cobblers news, here.
. CREWE, ENGLAND - AUGUST 20: Northampton Town manager Jon Brady has a selfie taken by a young fan at the end of the Sky Bet League Two between Crewe Alexandra and Northampton Town at Mornflake Stadium on August 20, 2022 in Crewe, England. (Photo by Pete Norton/Getty Images)
Northampton Town had an average crowd of 5.835 last season. Photo: Pete Norton
. Derby County (7)
Total crowd: 626.949 Average crowd: 27.259 Photo: Getty Images
. Ipswich Town (2)
Total crowd: 602.227 Average crowd: 26.184 Photo: Getty Images
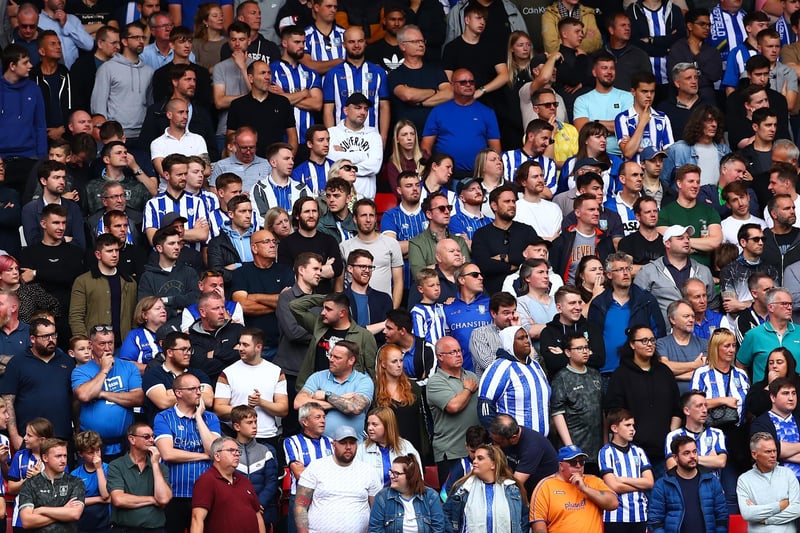
. Sheffield Wednesday (3)
Total crowd: 583.699 Average crowd: 25.378 Photo: Getty Images
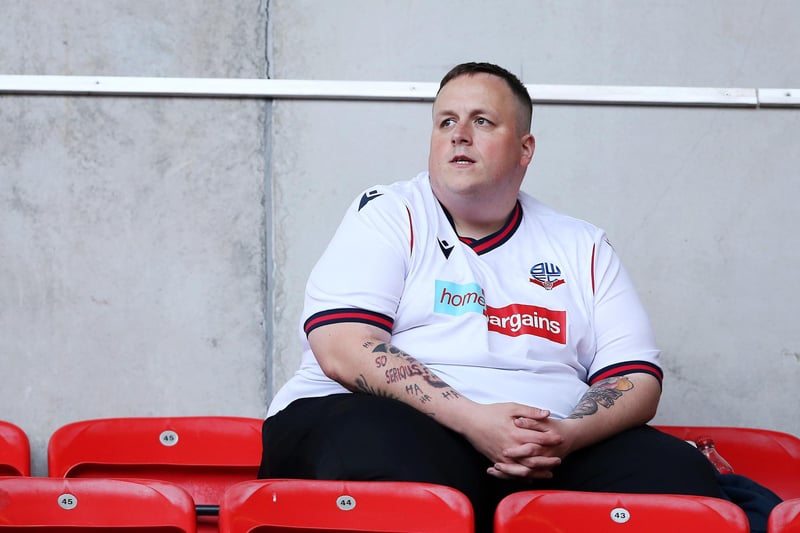
. Bolton Wanderers (5)
Average crowd: 432.713 Total crowd: 18.814 Photo: Getty Images
. Portsmouth (8)
Total crowd: 415.468 Average crowd :18.064 Photo: Getty Images
. Plymouth Argyle (1)
Total crowd: 358.321 Average crowd: 15.579 Photo: AFP via Getty Images
. Charlton Athletic (10)
Total crowd: 309.023 Average crowd: 13.436 Photo: Getty Images
. Barnsley (4)
Total crowd: 271.562 Average crowd: 11.807 Photo: Getty Images
1. Derby County (7)
Total crowd: 626.949 Average crowd: 27.259 Photo: Getty Images
2. Ipswich Town (2)
Total crowd: 602.227 Average crowd: 26.184 Photo: Getty Images
3. Sheffield Wednesday (3)
Total crowd: 583.699 Average crowd: 25.378 Photo: Getty Images
4. Bolton Wanderers (5)
Average crowd: 432.713 Total crowd: 18.814 Photo: Getty Images