

The Cobblers are only three points clear of the bottom three having played more games than most of the sides beneath them.
A large part of their problem this season has stemmed from a dire away record.
Town have picked up just 14 points on the road this term, with only Bristol Rovers matching that record.
If there has been a saving grace, it has been Northampton’s home form.
Seven wins, four draws, and nine losses is still only the 16th-best showing in the division, but it is also the only thing keeping their heads above water at the moment.
But how does that form compare to their home record over the past decade?
Bankrate.com have run the number on every League One side to see who has built up the strongest home fortress over the past 10 years.
Click and scroll through our countdown below...
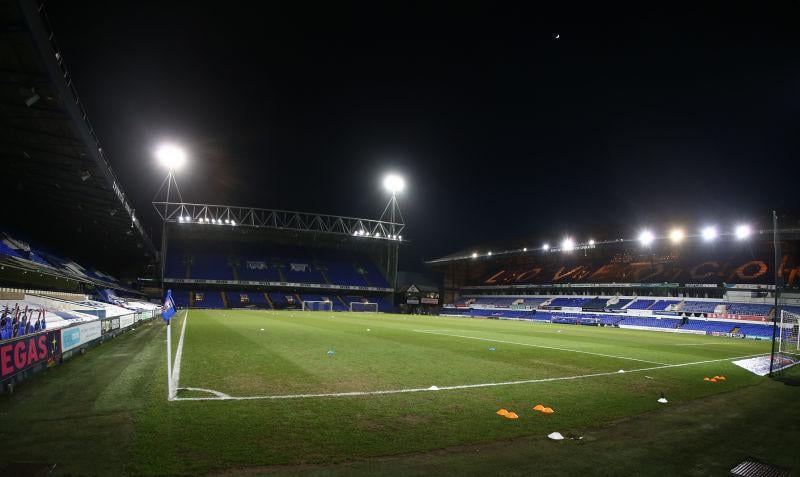
9. Ipswich Town
Games played: 240 Points: 367 PPG: 1.53 Win rate: 42% (Photo by Pete Norton/Getty Images) Photo: Pete Norton
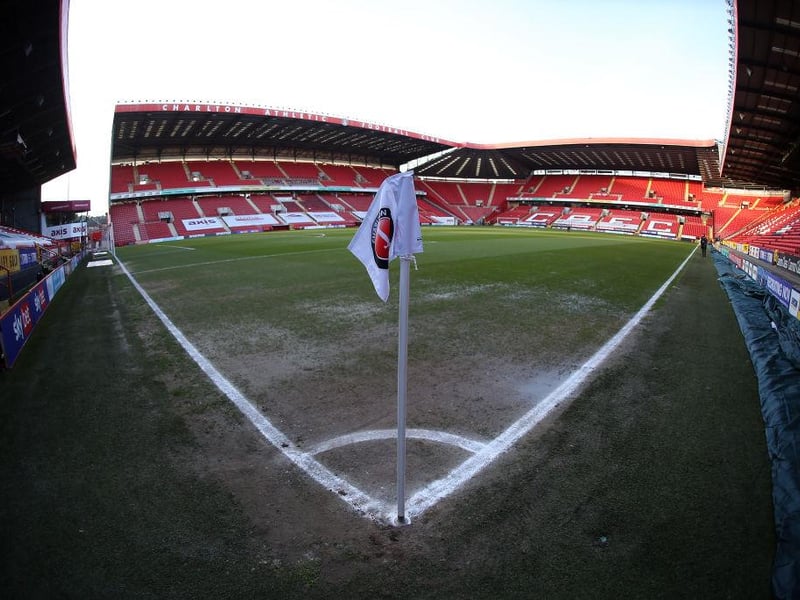
10. Charlton Athletic
Games played: 244 Points: 376 PPG: 1.54 Win rate: 42% (Photo by Pete Norton/Getty Images) Photo: Pete Norton
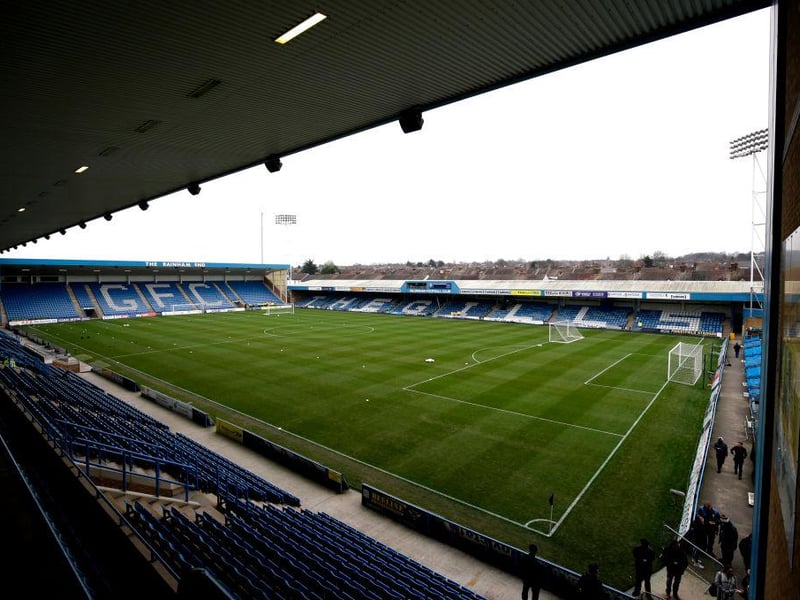
11. Gillingham
Games played: 240 Points: 372 PPG: 1.55 Win rate: 43% (Photo by Henry Browne/Getty Images) Photo: Henry Browne
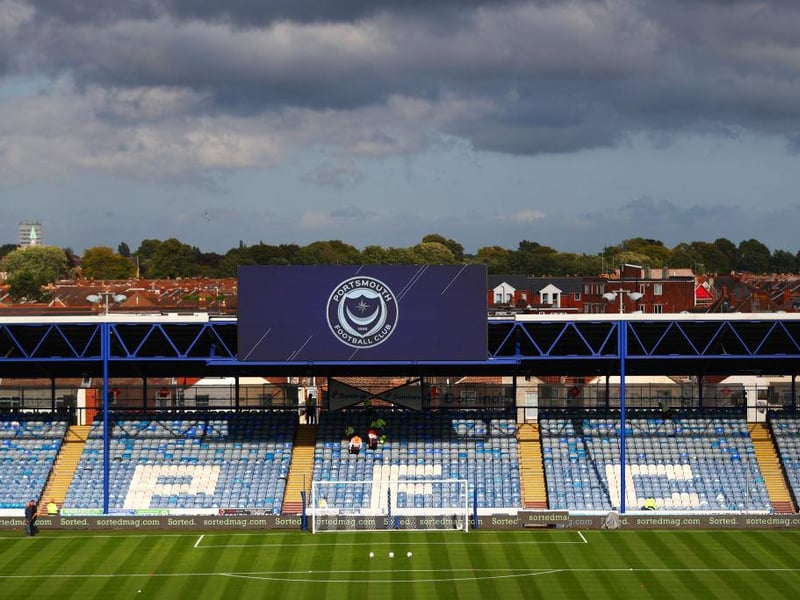
12. Portsmouth
Games played: 241 Points: 375 PPG: 1.56 Win rate: 46% (Photo by Dan Istitene/Getty Images) Photo: Dan Istitene