


With that in mind, we’ve gone through the various details and summarised the key figures here…
1. Turnover - £7.54m (up from £6.74m)
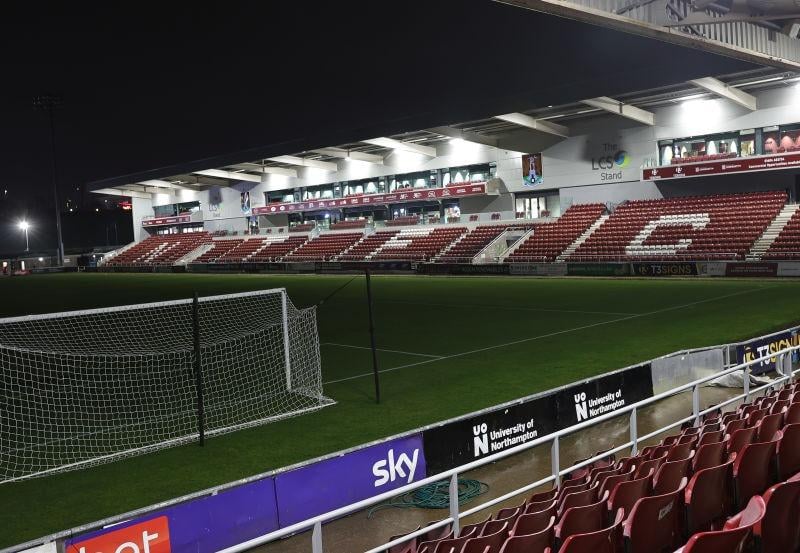
This is the club’s total income. It’s a record high, boosted by commercial growth (helped the new East Stand) and general revenue increases Photo: Pete Norton

2. Total loss - £2.99m (up from £2.03m)
The overall deficit for the year. Despite higher income, costs rose much faster for various reasons - largely the inflation of player wages - leading to a significantly bigger loss. Photo: Pete Norton

3. Staff costs - £6.22m (up from £5.13m)
Wages for players and staff. This is the biggest expense and jumped sharply due to a higher playing budget and rising wage pressures across football Photo: Pete Norton

4. Profit on player sales - £478k (up from £256k)
Money made from selling players. This generally means add-ons and clauses from past transfers Photo: Pete Norton
1 / 4