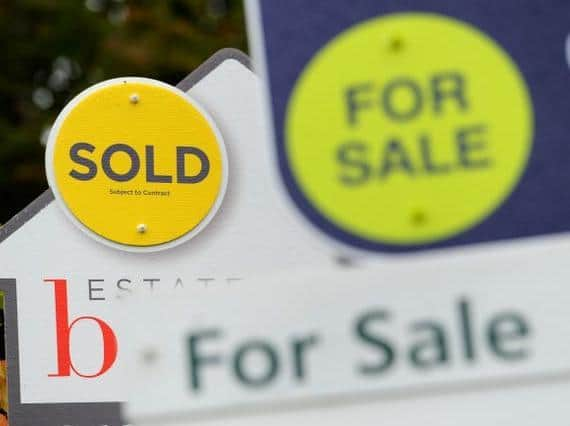
Northampton house prices carry on rising with another slight increase in March
and live on Freeview channel 276
House prices increased slightly, by half-a-percent in Northampton during March, new figures show.
The boost contributes to the longer-term trend, which has seen property prices in the area achieve seven percent annual growth.
Advertisement
Hide AdAdvertisement
Hide AdThe average Northampton house price in March was £225,681, Land Registry figures show – a 0.5% increase on February.
Over the month, the picture was less good than that across the East Midlands, where prices increased 1.9%, and Northampton underperformed compared to the 1.8% rise for the UK as a whole.
Over the last year, the average sale price of property in Northampton rose by £15,000 – putting the area 40th among the East Midlands’s 45 local authorities for annual growth.
The best annual growth in the region was in Oadby and Wigston, where property prices increased on average by a whopping 21 percent, to £275,000. At the other end of the scale, properties in East Northamptonshire gained 3.1 percent in value, giving an average price of £257,000.
Winners and Losers
Advertisement
Hide AdAdvertisement
Hide AdOwners of terraced houses saw the biggest improvement in property prices in Northampton in March – they increased 0.8 percent, to £192,588 on average. Over the last year, prices rose by 7.9 percent.
Among other types of property:
■ Detached: up 0.5 percent monthly; up 7.9 percent annually; £388,929 average
■ Semi-detached: up 0.3 per cent monthly; up 6.7 per cent annually; £232,200 average
■ Flats: up 0.4% monthly; up 3.7% annually; £130,191 average
First steps on the property ladder
Advertisement
Hide AdAdvertisement
Hide AdFirst-time buyers in Northampton spent an average of £199,000 on their property – £13,000 more than a year ago, and £40,000 more than in March 2016.
By comparison, former owner-occupiers paid £250,000 on average in March – 25.3 percent more than first-time buyers.
How do property prices in Northampton compare?
Buyers paid 2.6 percent more than the average price in the East Midlands (£220,000) in March for a property in Northampton. Across the East Midlands, property prices are lower than those across the UK, where the average cost £256,000.
The most expensive properties in the East Midlands were in Rutland – £362,000 on average, and 1.6 times as much as in Northampton. Rutland properties cost 2.4 times as much as homes in Bolsover (£149,000 average), at the other end of the scale.
The highest property prices across the UK were in Kensington and Chelsea, where the average March sale price of £1.3 MILLION could buy 14 properties in Burnley — where the average is £94,000.