Despite the pandemic and the economic upheaval that has accompanied the health crisis, house prices across England have held up and in many areas of Northampton, have even risen significantly.
Sales have fallen dramatically, but the market remains good for sellers as in a lot of areas across the town prices are higher than they were before the pandemic hit.
The ONS (Office for National Statistics) publishes house price figures by Middle Layer Super Output Areas (MSOAs) – small geographic areas containing an average of 7,200 people.
For Northampton, these figures show that 19 of the 31 areas of the town saw an increase in house prices between September 2019 and September 2020, despite fewer sales.
Some areas even saw an average rise of nearly 20 percent compared to the previous year.
Below are the 14 neighbourhoods where house prices have increased the most in the year to September 2020.
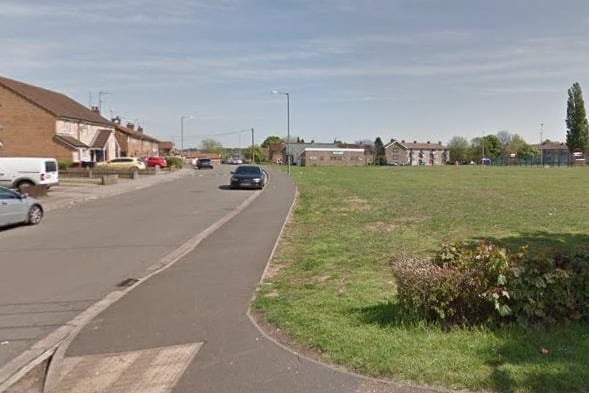
1. King's Heath and Spencer
At 19.3 percent, prices rose the most in this area. The average house price, as of September 2020, was £193,133. Photo: Google Maps.
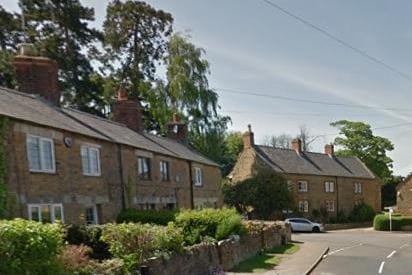
2. Boughton
Prices rose by 14.9 percent in Boughton. The average house price, as of September 2020, was £240,927. Photo: Google Maps.
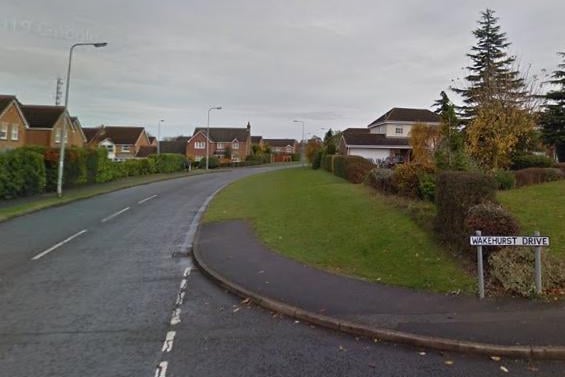
3. Wootton and Collingtree
House prices increased by 11.6 percent in this area, meaning the average house price reached £369,113 in September 2020. Photo: Google Maps.
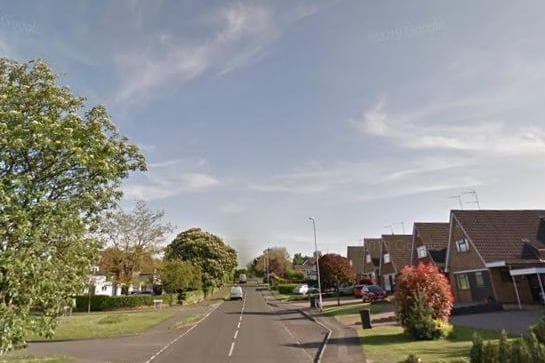
4. Boothville and Spinney Hill
The cost of homes increased by 5.7 percent in this area so the average house cost £243, 797. in September 2020. Photo: Google Maps.
