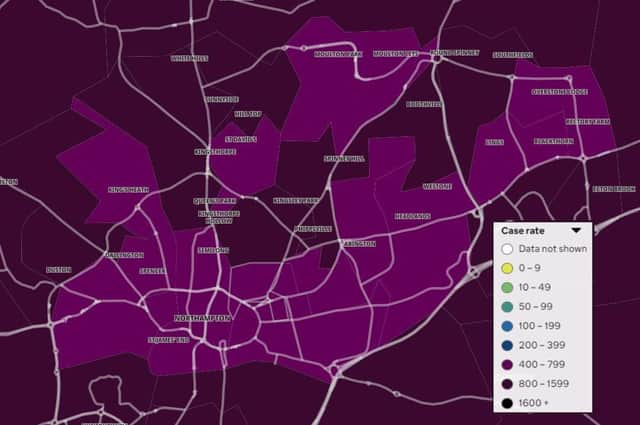
Covid-19 case rates more than doubled in six Northampton neighbourhoods as the Omicron variant took a firm hold in the run-up to Christmas.
And just ONE out of the 31 areas used by analysts to compare the virus spread — Stornton and Sixfields — saw a drop in cases during the seven days to December 23, according to the most recent official figures published on the government data dashboard.
There was no change in the rate in Moulton.
Boothville and Round Spinney saw the highest increase in case rates, up 166.6 percent in a week.
Neighbouring Phippsville and Abington Vale both saw increases of more than 150 percent.
Latest government data shows the number of new positive tests by people living in 31 areas of the town. Analysts convert those results into a 'rate' assuming each area has a population of 100,000.
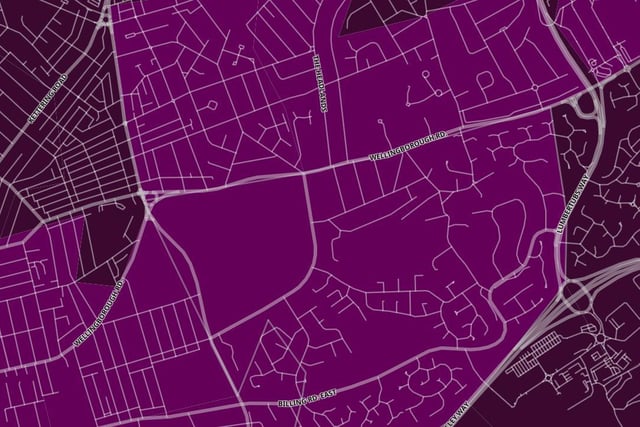
1.
Abington Vale — 316 new cases per 100,000 in week to December 16; 789.9 new cases per 100,000 in week to December 23; 150.0% increase
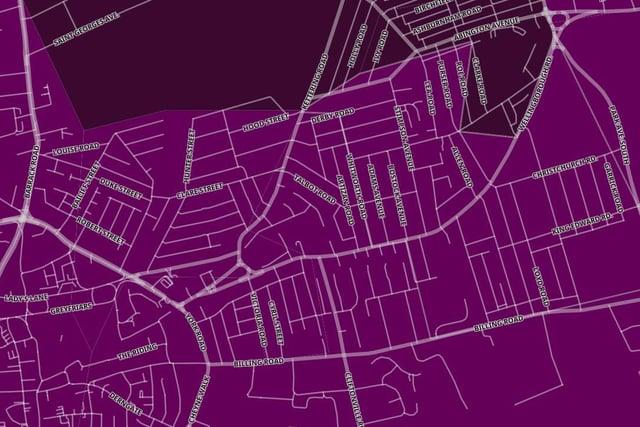
2.
Abington — 529.3 new cases per 100,000 in week to December 16; 780.7 new cases per 100,000 in week to December 23; 47.5% increase
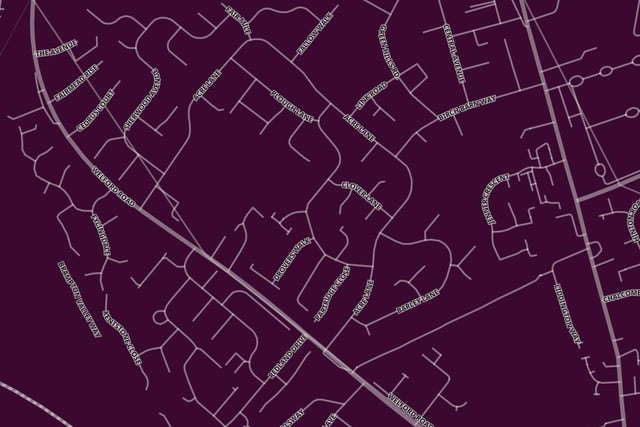
3.
Sunnyside — 721 new cases per 100,000 in week to December 16; 1179.7 in week to December 23; 63.6% increase
4.
Billing & Riverside — 595.3 new cases per 100,000 in week to December 16; 965.4 new cases per 100,000 in week to December 23; 62.2% increase
