

More than 15 areas of Northampton are seeing Covid-19 cases rise faster than the national average.
Latest figures show one ward reported enough positive tests in a week to give it an infection rate of nearly 600.
Data analysts divide the county into areas with roughly equal population — around 7,200 — to find comparisons on how coronavirus is spreading using figures for new positive tests and calculating the number assuming each 'Middle Layer Super Output Area' had a 100,000 people.
One area, New Duston West, recorded 30 lab-confirmed positive tests in the week to November 11 — six days into the four-week national lockdown.
That gave the area an infection rate of 567.9 per 100,000 — the highest in Northamptonshire.
Abington Vale and Kings Heath were other areas with infection rates over 300.
All those who test positive are told to self-isolate for ten days while close contacts identified by the Test and Trace service must stay at home for two weeks.
If your own area is not listed here, you can find it by entering a postcode on an interactive map which is updated daily on the Government's coronavirus dashboard.
5.
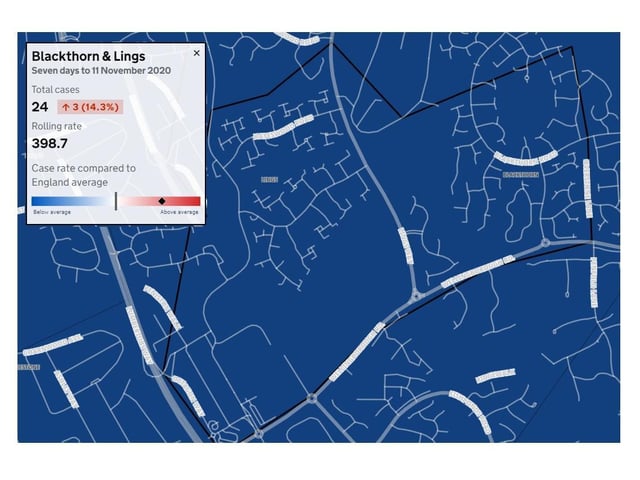
Blackthorn & Lings — Total cases: 24. Increase from previous week: 3 (14.3%) — Rolling rate 398.7
6.
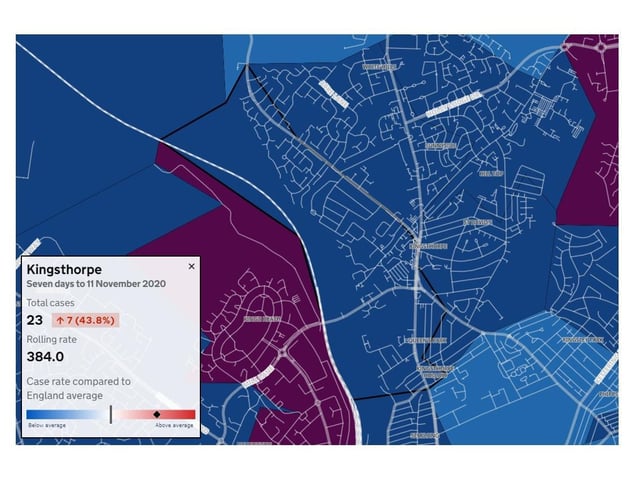
Kingsthorpe — Total cases: 23 — Increase from previous week: 7 (43.8%) — Rolling rate: 384.0
7.
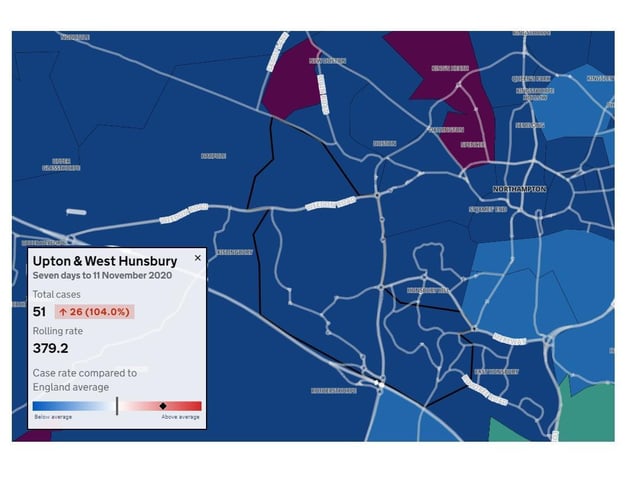
Upton & West Hunsbury — Total cases: 51 — Increase from previous week: 26 (104.0%) — Rolling rate: 379.2
8.
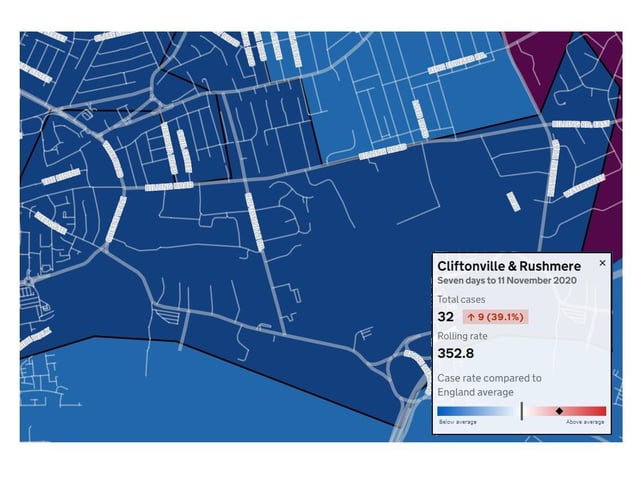
Cliftonville & Rushmere — Total cases: 32 — Increase from previous week: 9 (39.1%) — Rolling rate: 352.8