

Covid-19 infection rates are falling in Northamptonshire — nut not fast enough to keep up with the rest of the country.
The Chronicle & Echo identified 11 areas of the town which were averaging more than 300 new cases a week less than a fortnight ago.
All 11 have since seen significant reductions during the national lockdown — but more than half are still way ahead of the national average.
New Duston West has seen it's infection rate tumble from 567 cases per 100,000 people to 170 in the week to November 24. But that is still only a fraction below the national average of 171.3.
And local health officials are warning the public not to be lulled into a false sense if security as the lockdown ends on Wednesday.
Public Health Director Lucy Wightman said: “The number of cases recorded in the last week is really disappointing in light of the fact we have been in lockdown, .
"It’s true that the number of cases in the last week has decreased. But the significant spike in cases the week we entered national restrictions means we have yet to return to our pre-lockdown position.
“This week we will be placed in Tier Two, which is officially high on the three-tier alert system. Lockdown restrictions may start to ease regarding certain activities.
"But now, more than ever, we must not be Covid-complacent and we continue to keep ourselves and our loved ones protected from the virus and make sure we are in a better position come Christmas.”
Data analysts use areas of roughly equal population — known as Middle Layer Super Output Areas — each with an average of 7,200 people.
They allow a four or five day period after raw data is published for corrections to be made, convert the figure into a figure assuming each area had a population of 100,000 then add the numbers to an interactive map.
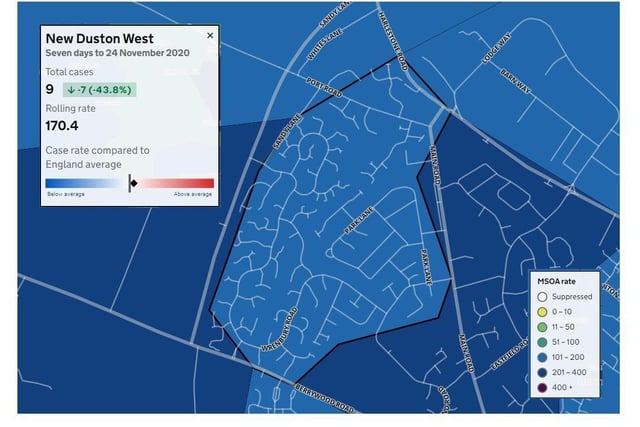
1.
New Duston West — 9 total cases in seven days to Nov 24 — Decrease since previous week:7 (43.8%) — Rolling rate: 170.4 per week per 100,000 people — Rolling rate on Nov 17 was: 567
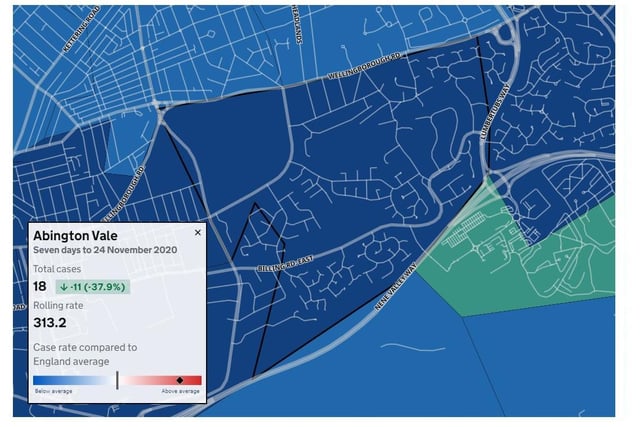
2.
Abington Vale — 18 total cases in seven days to Nov 24 — Decrease from previous week: 11 (37.9%) — Rolling rate: 313.2 — Rolling rate on Nov 17 was: 435
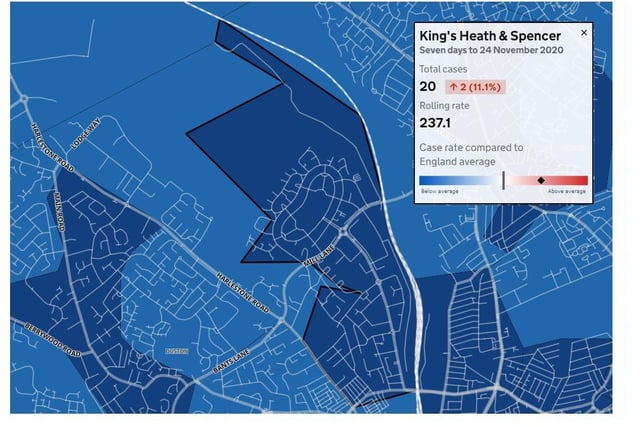
3.
King's Heath & Spencer — 20 total cases in seven days to November 24 — Increased from previous week: 2 (11.1%) — Rolling rate: 237.1 — Rolling rate on Nov 17 was: 403
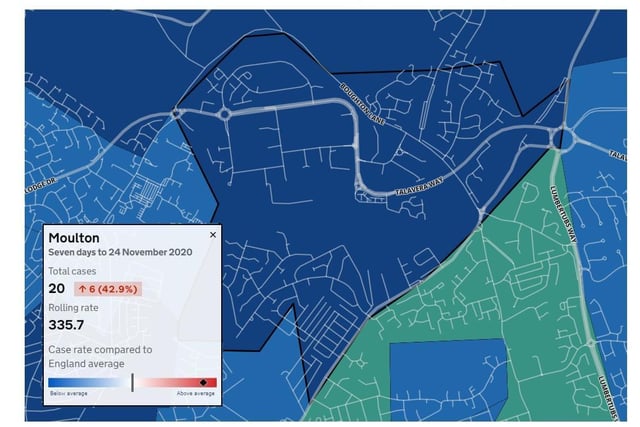
4.
Moulton — 20 total cases in seven days to November 24 — Increased from previous week: 6 (42.9%) — Rolling rate: 335.7 — Rolling rate on Nov 17 was: 402