

These figures come from the Gov.uk website service that allows free access to find and compare school data in England. The figures show the percentage of pupils ate the schools that got a level 5 (C in the old system) or above in Maths and English. They are also scored according to the Progress 8 Report, which measures how well pupils have progressed since their starting point at the beginning of secondary school. The average for Progress 8 is shown as 0, and a score above or below that indicates how a school measures up to the average on this metric. This is based on the 2019 provisional results. For some schools data was not available.
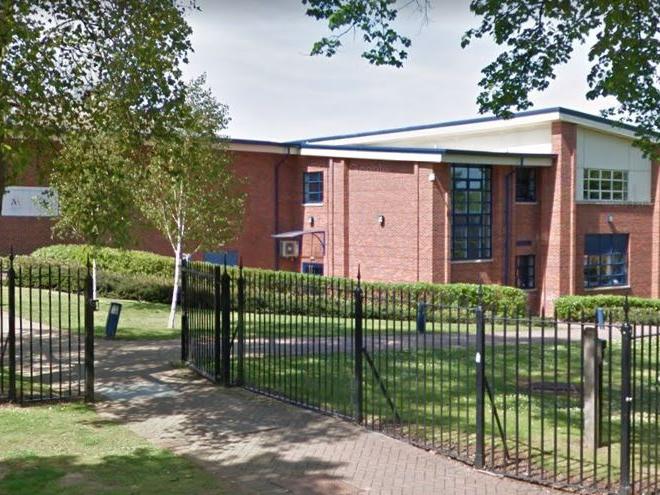
9. Malcolm Arnold Academy
29.5 per cent of pupils achieved a grade five or above in their English and maths GSCEs. They hold a progress 8 score of -0.15.
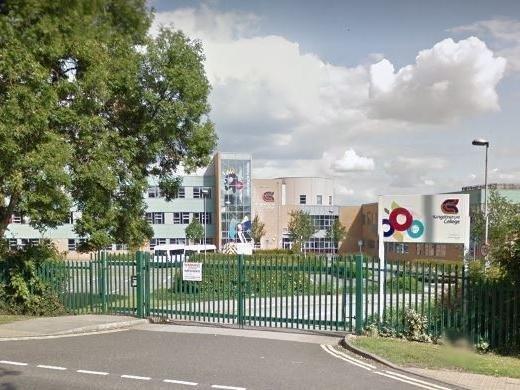
10. Kingsthorpe College
26.6 per cent of pupils achieved a grade five or above in their English and maths GSCEs. They hold a progress 8 score of -0.2.
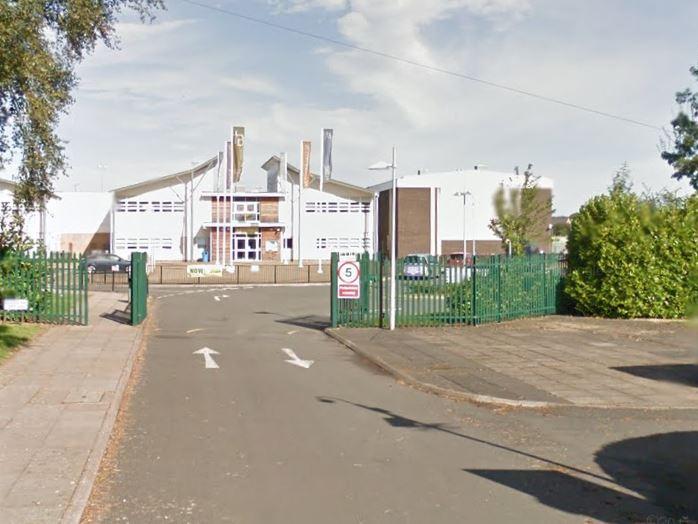
11. Thomas Beckett Catholic School
17.9 per cent of pupils achieved a grade five or above in their English and maths GSCEs. They hold a progress 8 score of -0.26.